网址:https://ww2.mathworks.cn/help/signal/gs/waveform-generation-time-vectors-and-sinusoids-1.html
描述:本案例由1个示例构成。
-
针对以上案例,采用Python语言实现。
-
大多数工具箱函数要求从表示时基的向量开始。例如,假设以 1000 Hz 采样频率生成数据。合适的时间向量是np.linspace(0,1,1001)。
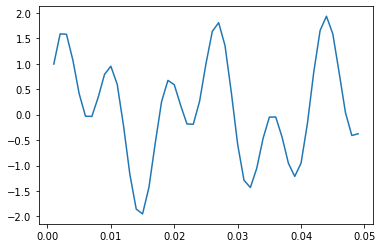
在给定 t 的情况下,可以创建由两个正弦波组成的示例信号 y,第一个正弦波的频率为 50 Hz,另一个的频率为 120 Hz 且幅值是第一个正弦波的两倍。
python
import numpy as np
import matplotlib.pyplot as plt
python
t = np.linspace(0,1,1001)
#Generate a time vector in steps of 1 ms
y = np.sin(2 * np.pi * 50 * t )+np.sin(2 * np.pi * 120 * t )
#create a sample signal y consisting of two sinusoids, one at 50 Hz and one at 120 Hz
由向量 t 构成的新变量 y 的长度也是 1001 个元素。您可以将正态分布的白噪声添加到信号中,并绘制前 50 个点:
python
n = 1001
white_noise = np.random.standard_normal(size=n)
#Generate Gaussian white noise
yn = y + white_noise
plt.plot(t[1:50],y[1:50])
#add normally distributed white noise to the signal and plot the first 50 points
plt.show()